Product Design | AI Design
Sentiment Sensor + Hypothesis Generation
Sentiment Sensor + Hypothesis Generation
Sentiment Sensor + Hypothesis Generation
Enhancing Usersnaps Insights and introducing AI into the product
Enhancing Usersnaps Insights and introducing AI into the product
Enhancing Usersnaps Insights and introducing AI into the product
Background
Background
Background
Beyond simply gathering user feedback, the Usersnap team recognized a need for deeper clarity and execution. This initiative was driven by a single goal: to empower B2B product managers to not only collect insights but to understand and act on them effectively.
My role in this initiative was to design a new insights page that would surface the 3 most positive and negative sentiment trends for our users and allow them to take further action on it.
Tools:
Miro
Figma
Jira
Skills:
Low + Hi- Fidelity
Prototyping
Usability Test
Tools:
Miro
Figma
Jira
Skills:
Low + Hi- Fidelity
Prototyping
Usability Test
Design Round 1
Design Round 1
Design Round 1
For the initial iteration, I moved away from standard bar charts to develop a sentiment trend line. This visualization plotted time on the X-axis against a sentiment magnitude score on the Y-axis, capturing both positive and negative fluctuations.
This approach was driven by three strategic goals:
Visual Differentiation: It established a unique visual identity for "Sentiment Sensor," distinguishing it from the static bar charts used throughout the rest of the Usersnap platform.
Alignment with PM Workflows: Product teams naturally look for spikes and patterns; this format mirrors how they track bug reports or performance during release cycles.
Proactive Analysis: By visualizing magnitude over time, it became easy for users to pinpoint sudden sentiment shifts and immediately investigate the root cause.

Caption: Version 1 of the sentiment sensor wireframe exploring sentiment magnitude.
Caption: Version 1 of the sentiment sensor wireframe exploring sentiment magnitude.
Design Round 2
Design Round 2
Design Round 2
In the next iteration, I gathered feedback and I restructured the visualization to place negative sentiment below the baseline, creating a clear vertical separation from positive feedback.
This structural shift was based on two key insights:
Prioritizing the "Pain": B2B Product Managers often prioritize negative sentiment to identify friction points. Giving the negative axis its own dedicated space makes these "areas for improvement" more prominent and easier to scan.
Scalability for Hypothesis Generation: By separating the two, I ensured the layout could accommodate future "Hypothesis Generation" features. This provides the necessary vertical real estate for deeper analysis and expansion without cluttering the positive sentiment data.
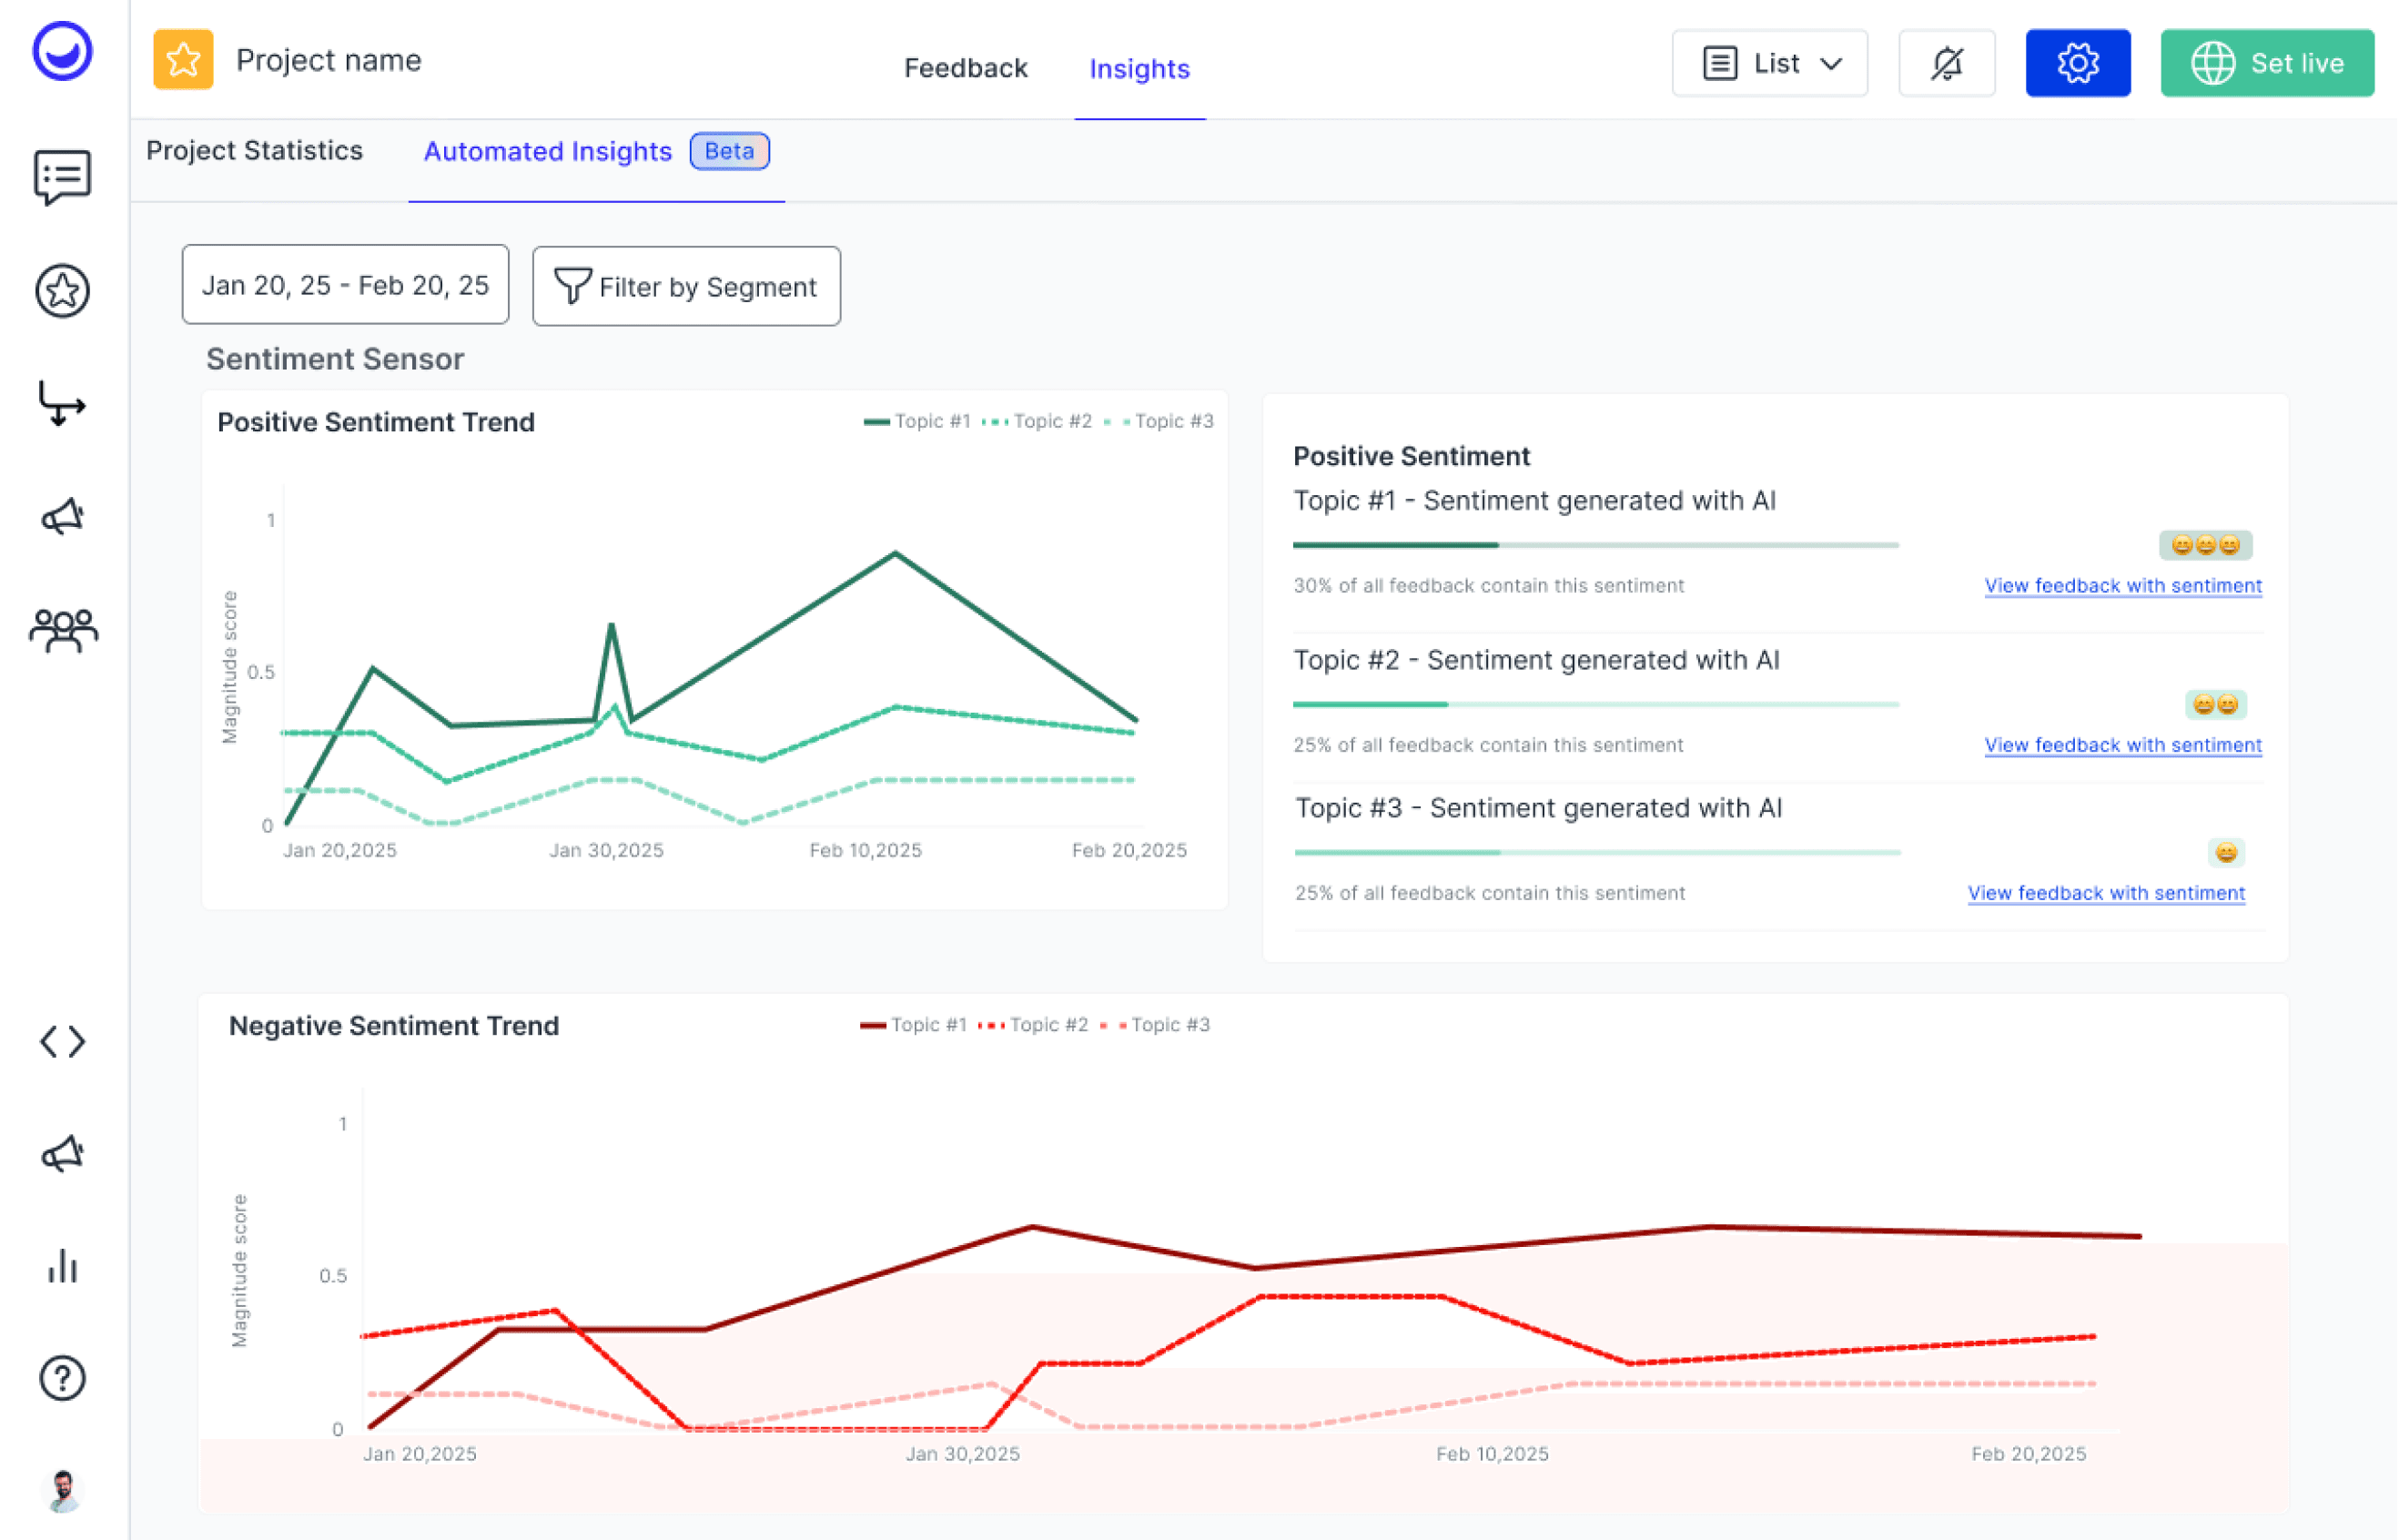
Caption: Version 2 of the sentiment sensor design where negative sentiment takes more space and affords space for hypothesis generation to be added.
Caption: Version 2 of the sentiment sensor design where negative sentiment takes more space and affords space for hypothesis generation to be added.
Caption: Version 2 of the sentiment sensor design where negative sentiment takes more space and affords space for hypothesis generation to be added.
From Insight to Action
From Insight to Action
From Insight to Action
Once the sentiment trend was established, the next challenge was helping PMs answer the "Why?" behind the data. This led to the development of Hypothesis Generation.
Once the sentiment trend was established, the next challenge was helping PMs answer the "Why?" behind the data. This led to the development of Hypothesis Generation.
Hypothesis Generation
Hypothesis Generation
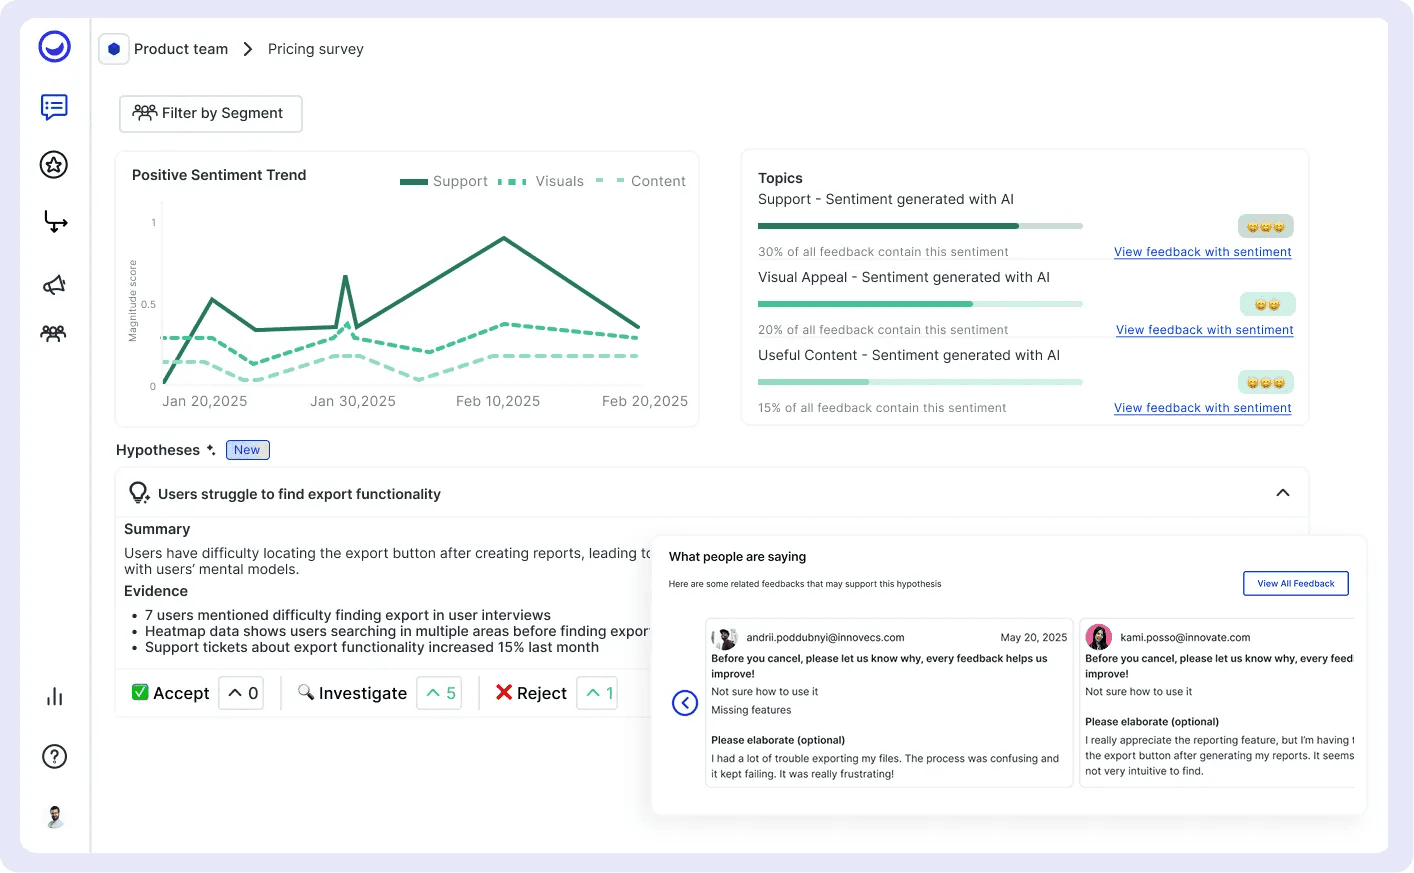
I designed our hypothesis generation flow, which allows users to drive into more tangible details related to sentiment topics, explore hypotheses generated with AI and vote on hypotheses to take action on.
To avoid overwhelming the user with data or too much text, I focused on a "drill-down" UI pattern:
Contextual Triggers: Users can interact directly with a trending sentiment topic and generate hypotheses with AI.
The Hypothesis Preview: When hypotheses are generated, they can be further expanded to view evidence points and users can accept, reject, or vote to investigate a hypothesis, collaborating with team members.
Hypothesis Detail page: The natural next flow is to view details of the hypothesis and view feedback supporting this hypothesis.
Final version of the insights page with the sentiment sensor ui, hypothesis generator and hypothesis details page.
Final version of the insights page with the sentiment sensor, hypothesis generator and hypothesis details page.
Setting the Foundation for Actionable Insights
Setting the Foundation for Actionable Insights
Setting the Foundation for Actionable Insights
By moving beyond simple data visualization and into hypothesis-driven analysis, we transitioned the platform from a feedback collector to a strategic partner in the product discovery process.
By moving beyond simple data visualization and into hypothesis-driven analysis, we transitioned the platform from a feedback collector to a strategic partner in the product discovery process.
Key Outcomes
Key Outcomes
Established a New Product Pillar: This project defined the design language and functional framework for Usersnap’s "Insights" tab, providing a scalable foundation for all future analytical features.
Competitive Positioning: By closing the gap between raw feedback and actionable hypotheses, we addressed a critical pain point for B2B PMs, strengthening our position against competitors who only offer static reporting.
Future-Proofed Architecture: The UI was designed to scale; it now supports a complex ecosystem of sentiment tracking and hypothesis testing without sacrificing the user’s cognitive load.
Final Reflection
Final Reflection
This project reinforced the importance of designing for the "Next Step." As a designer, my goal wasn't just to show the user that their sentiment was dropping—it was to build the bridge that helps them understand why and what to do about it. This "Insight to Action" flow now serves as the backbone for how our users drive product improvements.
This project reinforced the importance of designing for the "Next Step." As a designer, my goal wasn't just to show the user that their sentiment was dropping—it was to build the bridge that helps them understand why and what to do about it. This "Insight to Action" flow now serves as the backbone for how our users drive product improvements.
let’s connect
let’s connect
I'm available via LinkedIn or Email for questions or conversation.